Solar monitor with jqPlot and TED5000
I have a solar powered home. Well, sort of. It is a grid-tied solar system, meaning when it is sunny outside our solar panels produce more power than we use and we bank that power with our utility company. At night time, we draw from the power we banked during the day.
I have a TED5000 energy monitor to keep tabs on how much power we are producing and how much we are consuming. The TED5000 is great, but the interface is a bit lacking for me. It has all the information I need, but it is buried in several different screens. Answering the questions how much solar power did we generate today, or what was our net usage, or did we ever produce more than we used during a day are not immediately visible on the interface.
I had been wanting to teach myself jQuery, so when I found jqPlot it seemed like the right time to dive in and make a new interface. The result, a real time view into our daily energy production and consumption.
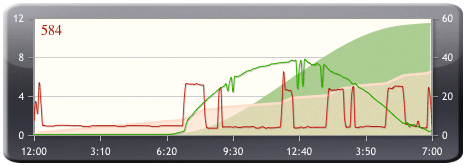
The time of day is represented on the X-axis and is updated every 5 minutes with the latest data from the TED5000. The left Y-axis shows the average power during the 5 minute period and is related to the green and red lines on the graph. The right Y-axis shows the total energy produced and is related to the area curves on the graph. Green represents solar production and red represents energy consumption. Finally, the number in the upper-left of the graph is updated every 5 seconds and displays the current net power.
I still use the TED5000 for its monthly estimates, but the new jqPlot powered display is a nice new way to see the data.